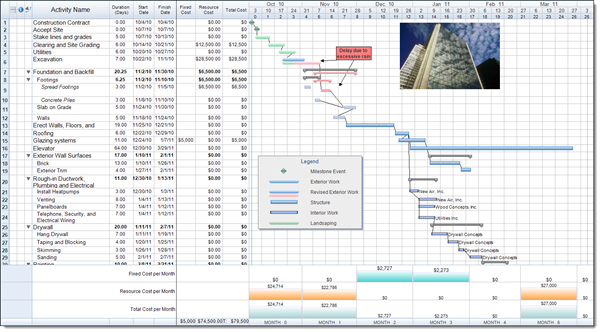
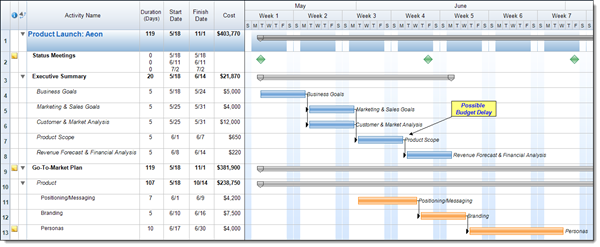
In our projects there can be a wide variety of data that we need to keep track of such as dates, durations, resources assigned, costs, and other data. However we may not always be able to display the data we wish to track directly within a column. In some cases we may want to easily display a cash flow chart for our project. In FastTrack Schedule 10 there are many pre-defined Summary Graphs, within both new, blank files and our Free Project Management Templates, which can be used to easily convey cash flow style information.
By default every schedule will have several Summary Graphs that users can easily view. The most commonly used Summary Graphs are found within the Cost Layout and provide information on Resource Costs, Fixed Costs, and Total Costs on a monthly basis. These graphs use the data from each corresponding column (Resource Cost, Fixed Cost, Total Cost) to calculate where the costs occur throughout the project. This can be further refined by adjusting the time increments in the graphs.
Continue reading “Pre-Defined Summary Graphs in FastTrack Schedule 10”


 Have you ever had a project resource that wasn’t really contributing? Who am I kidding…if you’ve managed more than 10 projects, chances are you’ve run into this.
 Control. We all like to be in control of what we are living, managing and doing on a daily basis, right? Both personally and professionally. At least it’s the goal. From a professional standpoint – from a project management standpoint – as we go about our processes of managing all of the projects on our plate that can often mean organizing our activities across four, five or even six live projects at a time. Maintaining control of those projects can sometimes be an issue.
 You know the drill – you’re hypothetically stuck somewhere (often a desert island is used but the problem is there is no WIFI on a desert island) and someone asks you what five or ten things would you want to have with you over everything else. Commonly people ask what five or ten music albums would you want for listening to for the rest of your life. Here I’m asking – if you were stuck somewhere remote and left to manage projects from there – what would you want to manage projects on an ongoing basis from this stuck, remote location for an extended period of time.
 Do you have a project management office (PMO) in your organization? If so, is it successful? Is it contributing to individual project successes by its project managers? If not, is there one in your company’s future? Is the PM practice growing to the point where a PMO would be a welcomed addition to help streamline the PM practice and processes?
 Our customer – whoever that may be – wants something done, right? That may be an external customer, an internal customer…it may even be our own CEO. But, is what they want done even feasible? First, you have to get past the cover your own neck concept of the thought of going through a complete project to create a solution or product exactly like your customer asks only to have it be something completely unusable in the market place or by the customer’s end user community. In that scenario you – the project manager – look bad (very bad) because you delivered something unusable even if it wasn’t your own direct fault. Rather, you have to see the big picture and understand that it’s about making a customer happy and not completely wasting their money in the process.
 Are all projects basically the same? Do best practices translate from project to project and industry to industry? What’s your take? I’m going to discuss my take on this and then I’d like to hear from you on your thoughts.
 No question, the project budget is critical. Customer funding is based on it, project success is derived from how closely you manage to it, and without it you can’t perform any work on the engagement.
 Issues come up, bumps in the road occur, many things work against the project manager and his team throughout the engagement as they try to deliver on the project. That said, there are a few negative things or statements from the project team, the customer, and even the PM’s senior management that can basically ruin the PM’s day as he tries to successfully deliver on the project. I’m sure there about 500 more such statements, but I thought it would be interesting to examine four relatively common ones in this article.
 We all hit the wall at some point. Projects go awry, issues mount and we need to take action. The pressure mounts and tests our ability to make good sound decisions for our projects and for our project customers. What’s your point? At what point do you feel like you might be ready to pull all of your hair out and literally lose control? We all – at some time or another – reach that point where we just can’t take it anymore. And what it is depends on us. It may be too much distraction. It may be too much interruption. It may be too much stupidness (you’re resisting the very real temptation to slap someone upside the head – you know what I mean). Or it may be too much pressure. How we handle hitting that breaking point may say a lot about who we are and it may have a big impact on how we’re managing our projects and it may even have a big impact on our careers if the stressor or issue is big enough.