
Projects have the ability to greatly range in size and scope. While some projects are “short and sweet” others can extend to 100’s and even 1000’s of tasks. Because of this users need to be able to easily control what portion of the data is being displayed graphically at any point in time. FastTrack Schedule 10 allows users to make use of the Timeline Range in order to precisely control exactly what section of data is graphically displayed.
FastTrack Schedule 10 offers numerous predefined range options, the ability to customize ranges, as well as the ability to set the Timeline Range on the fly. To access Timeline Ranges go to Project > Timeline Ranges. Here we can see numerous predefined ranges which allow users to view work in current time periods such as: Current Day, Current Month, or even 90 Day Look Ahead. When we apply a range the Timeline Graph will automatically update to show only that chosen period of time.
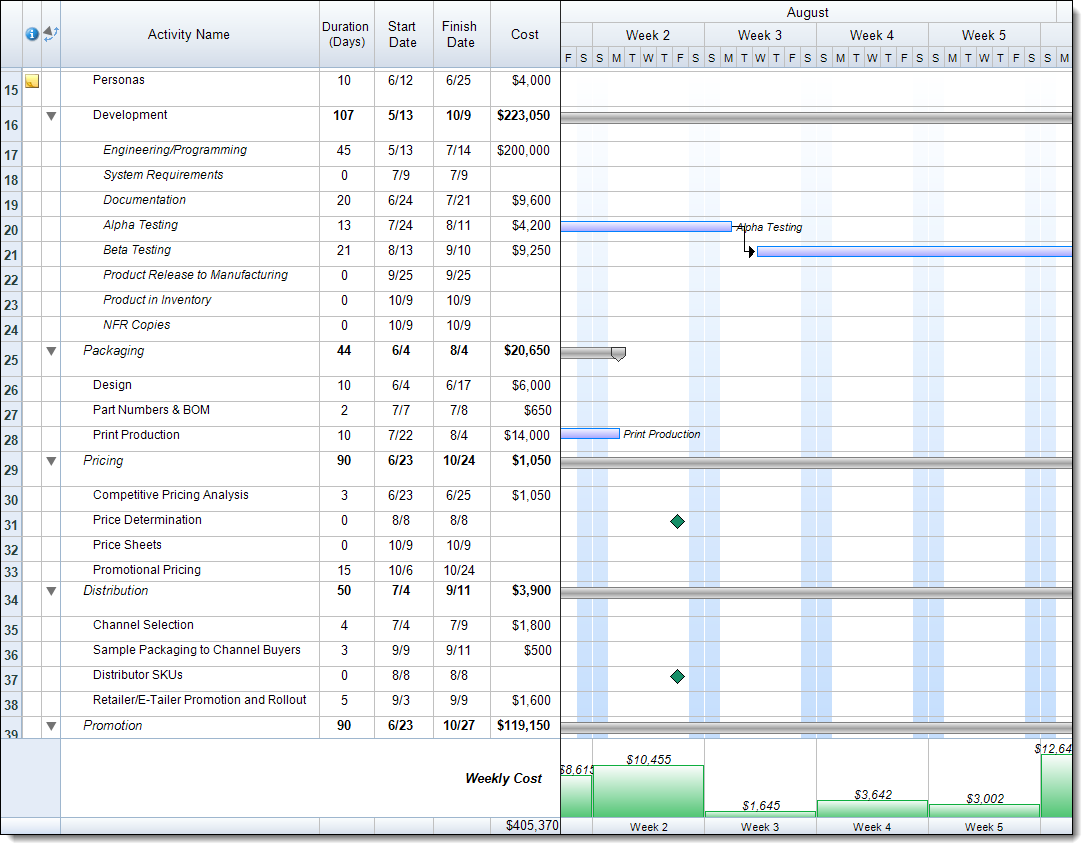
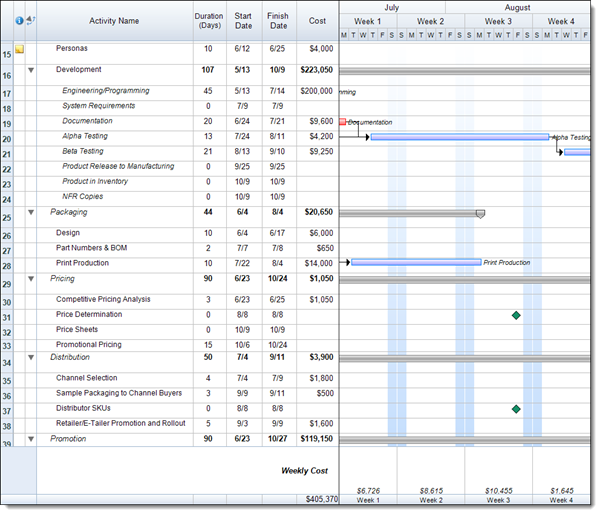
For example if we select to view the Current Month, the Timeline will update to graphically only show the current month; in this case August 2014. When we apply a range only the Timeline will change what is visible. Data in all rows and columns will be retained even if the data occurs outside of the selected range.
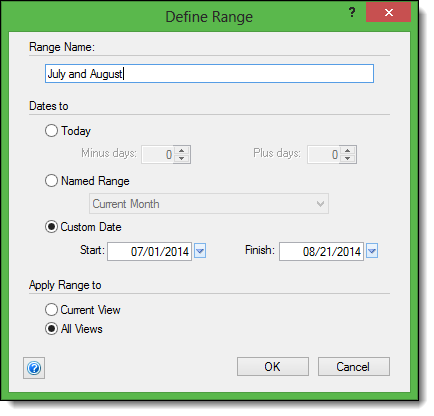
In addition to predefined ranges, users can customize ranges for any period of time. To create a customized Timeline Range go to Project > Timeline Ranges > Define. This will open the Ranges dialogue, where we can select New. This will open the Define Range Dialogue. Here we can enter a customized range name and select options for when the range of time should occur.
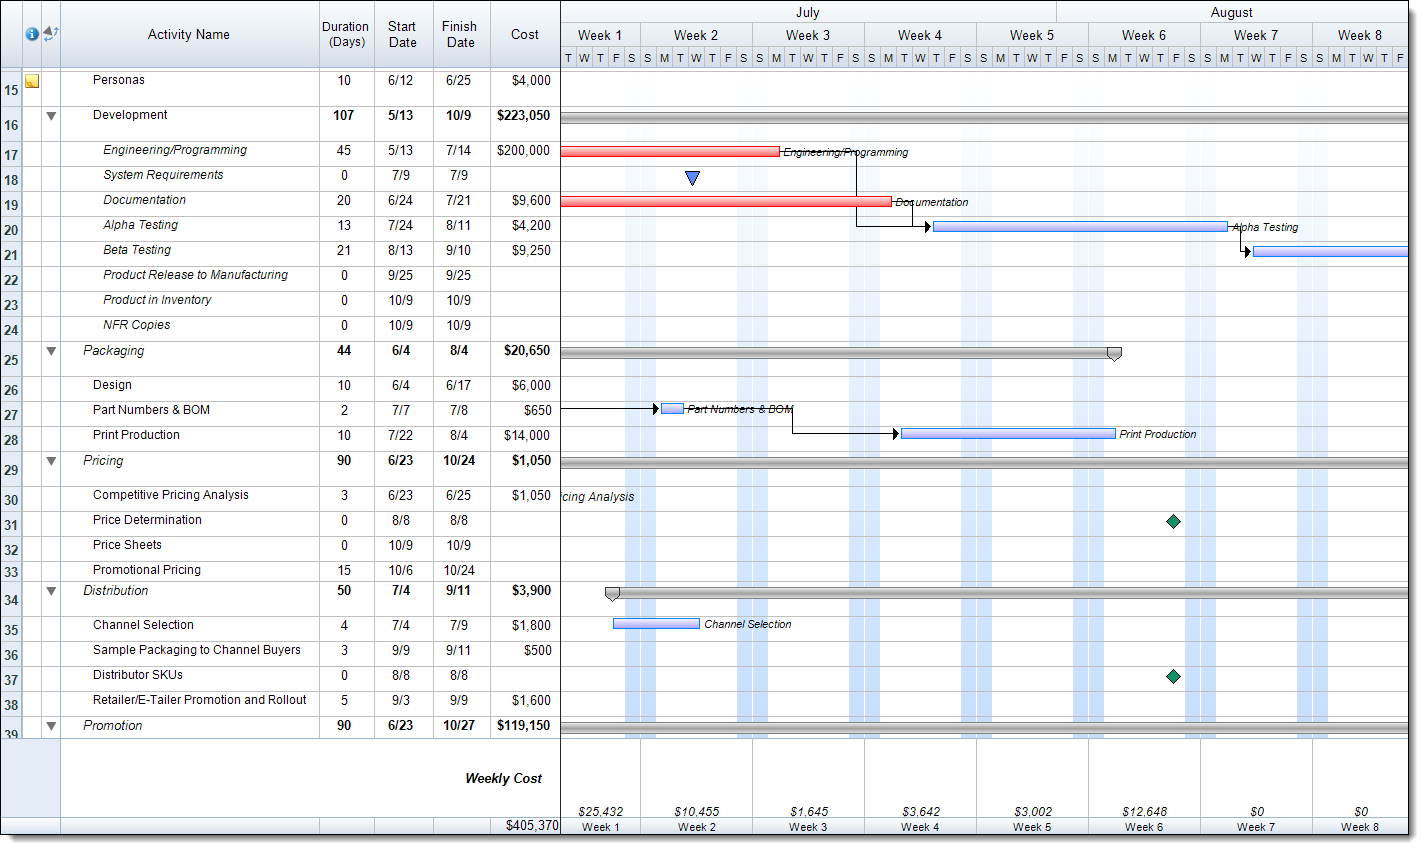
After selecting the range dates select OK to save the range and then select OK once again to apply the range. Once this is done, the Timeline Graph automatically updates to reflect this new range.
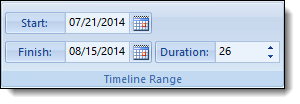
The final option for Timeline Ranges, is to set them on the fly. To do this you can use the Timeline Range tool, which is found directly above the Timeline Graph. This tool will allow you to manually enter in a Start Date, Finish Date, Duration or any combination of the three to set a specific range. As you enter values in each location the Timeline Graph automatically updates to reflect this change.
By using the Timeline Range tool users can easily control exactly what portion of the Timeline Graph is displayed for their project. This allows users to easily customize the graphical data that is shared with other users. How can you utilize both predefined and customized ranges to more easily control what data is visible within your projects?
