
In most of the projects that we work on we can track time using our “base units” of Hours, Days, Weeks, Months, Quarters, or Years. However in some projects we need to be able to track time in additional ways. For example: perhaps we would like to know the exact day into the year a task must start or finish on, or which week out of all 52 a task will occur during.
In FastTrack Schedule 10 we can add additional Timescales to our Timeline Graph which will allow us to track in any type of customized or generic time unit. Starting from our base units we can add generic options for each and then format them exactly as we’d like to see the time displayed within our project.
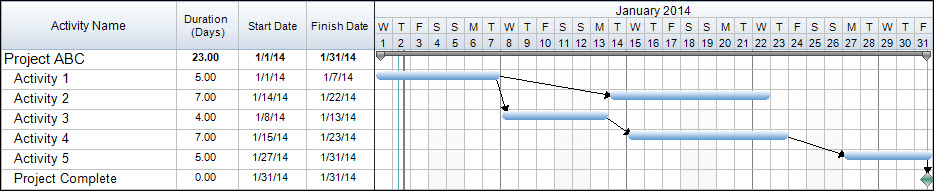
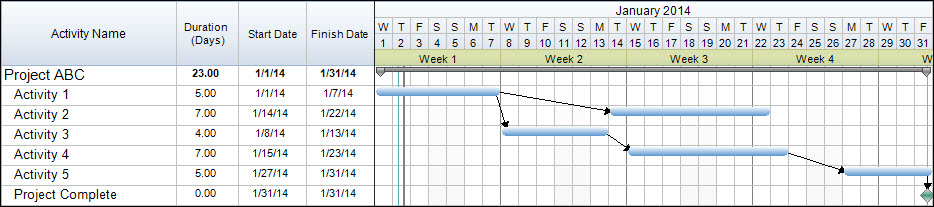
By default, in a new project our Timeline Graph is set to show days, with Timescales displayed for Numerical and Alphabetical Days, as well as the Month and Year.
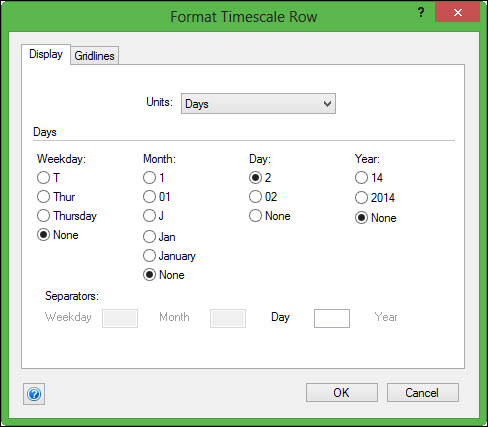
In addition to the Timescales that are currently visible we would also like to add in a Timescale to show the Generic Weeks of the project. To do this we can place our cursor over an existing Timescale and Right-Click or Control-Click.; then we select Insert Timescale. The Format Timescale Row dialogue will open where we can select the unit we wish to display and how the unit should be formatted.
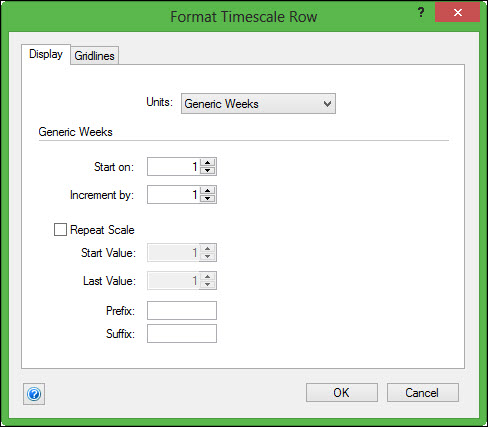
To enter our new Generic Weeks Timescale go to the Units drop down and select Generic Weeks. Next we can format how we wish the weeks to appear. The first option here is to set what week should the count start at; in this case we will start at 1. Next, for each unit displayed you can choose how to increment the label. In this case we will once again choose “one” so that our weeks follow a standard 1, 2, 3… format.
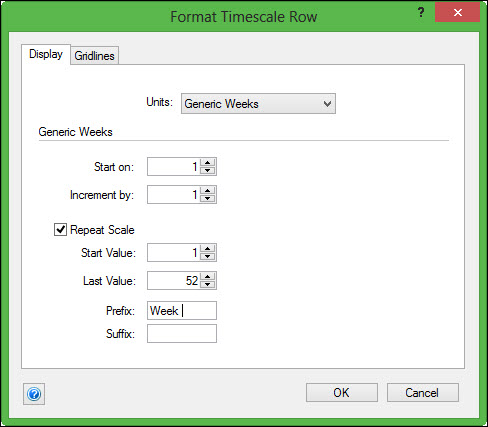
We also have the option to set up if/how this pattern should repeat. In this case we know there are 52 weeks within a year, so we would like this Timescale to start over with each new year. To do this select the box labeled Repeat Scale. Here our first value can be 1 and our last value will be 52. This means that once the scale has reached 52 it will start back at 1 for the first week of the next year. Lastly we can set up any type of label Prefix or Suffix that we wish to show in the Timescale. In this case we can enter a prefix of Week so that when we see the Timescale displayed we will know exactly what unit we are looking at.
Once we have set up our Timescale as we wish it to be displayed select OK to add it into our Timeline Graph.
When we insert our custom Timescale it appears last in our Timescale display. If we wish to change the display order, we can click and drag it to any order in the Timescales. To do this simply select anywhere within the new Timescale and then you can then click and drag to the new location. In the example below I have moved the Timescale to come beneath our Month/Year Timescale.
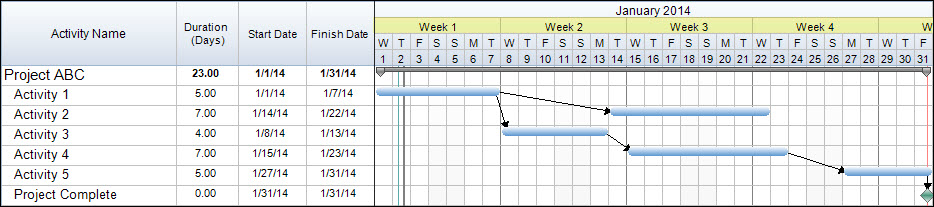
Now we can easily track exactly what week, out of the total 52, any task in our project occurs in. Of course we can also choose to add in any additional Timescales that we wish to use such as Generic Hours, Days, Months, Quarters, or Years. How can adding custom Timescales to your projects allow you to better track and view the time in which the project occurs?
