
Throughout our projects we will want to and need to keep an eye on certain types of data at a high level. For example: we may want to know the total time a group of tasks spans, or when that group of tasks start and finish. FastTrack Schedule 10 can display this information in 2 ways: with Summary Rows and Column Summaries. These sets of Summary Data will allow you to easily monitor the higher levels of your project. By default, Summary Rows are enabled for the Duration, Start Date, and Finish Date columns but we can also easily add these to almost any column in our project.
Our first set of summary data, Summary Rows, will appear in line with high level tasks which have other tasks or rows indented within them. FastTrack makes it easy to spot these by displaying the data in a bold font in each Summary Row.
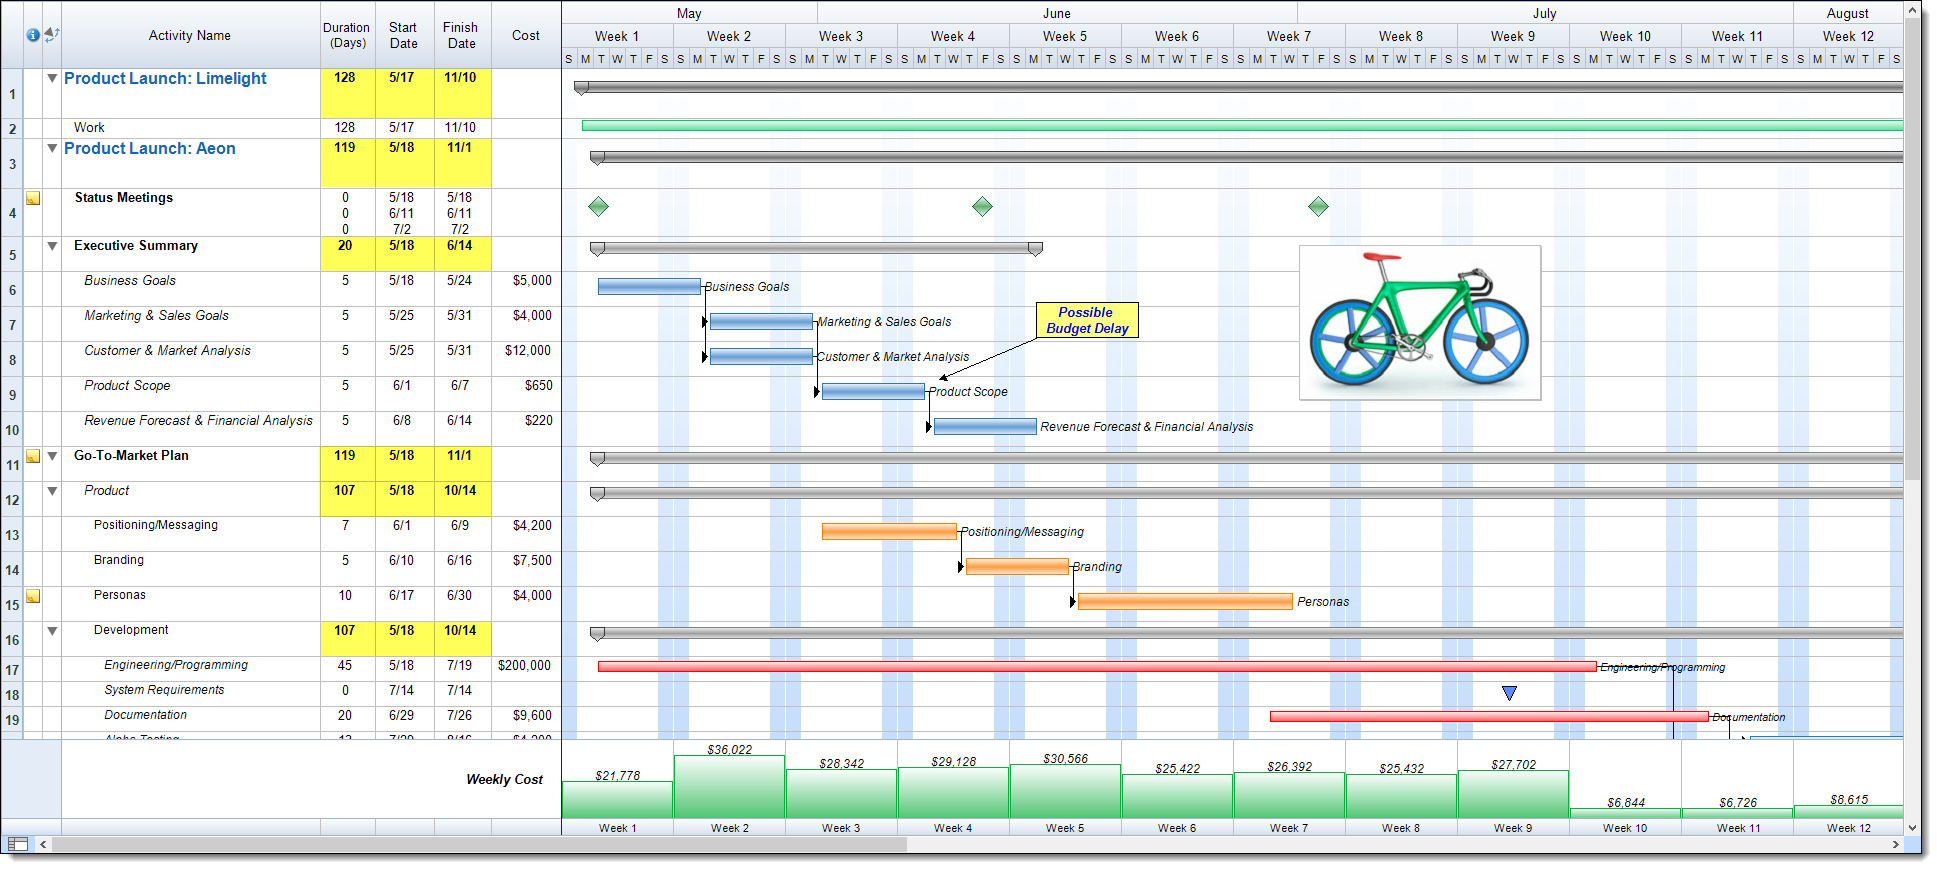
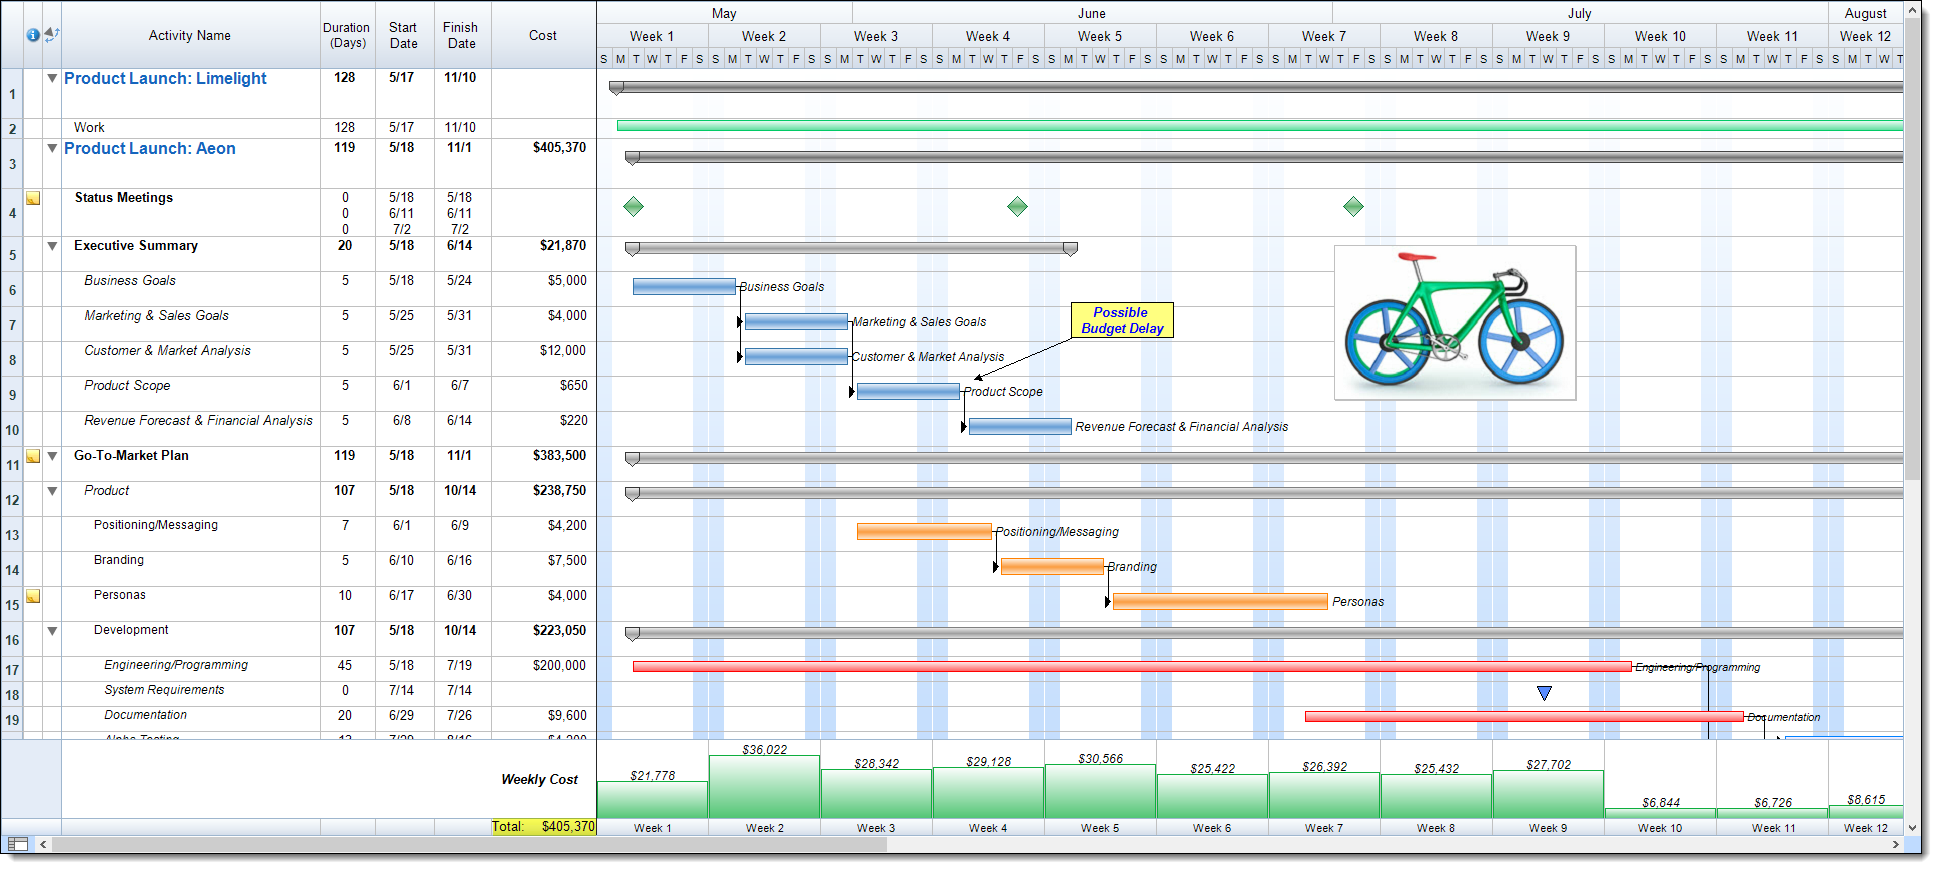
These are not the only columns that we can show Summary Row data for. Almost any column type can utilize a Summary Row including: Costs, Numbers, and Calculations. In the image above we can see a column labeled Cost which currently provides task-by-task costs throughout our project. However, if we want to see the cost at various higher levels we can easily display the Summary Row values.
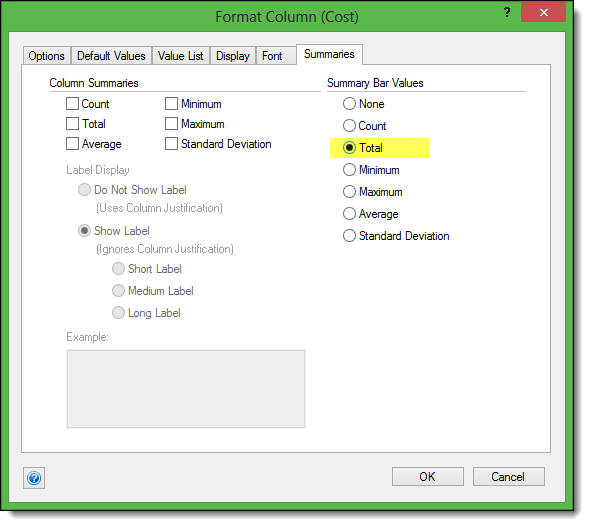
To do this, double-click on the Cost column header and then select the tab labeled Summaries. Here we can see that there are several options available for how the summary should be displayed including: Total, Minimum, Maximum, etc. We will select the option of Total which will provide the Total Cost for a group of tasks.
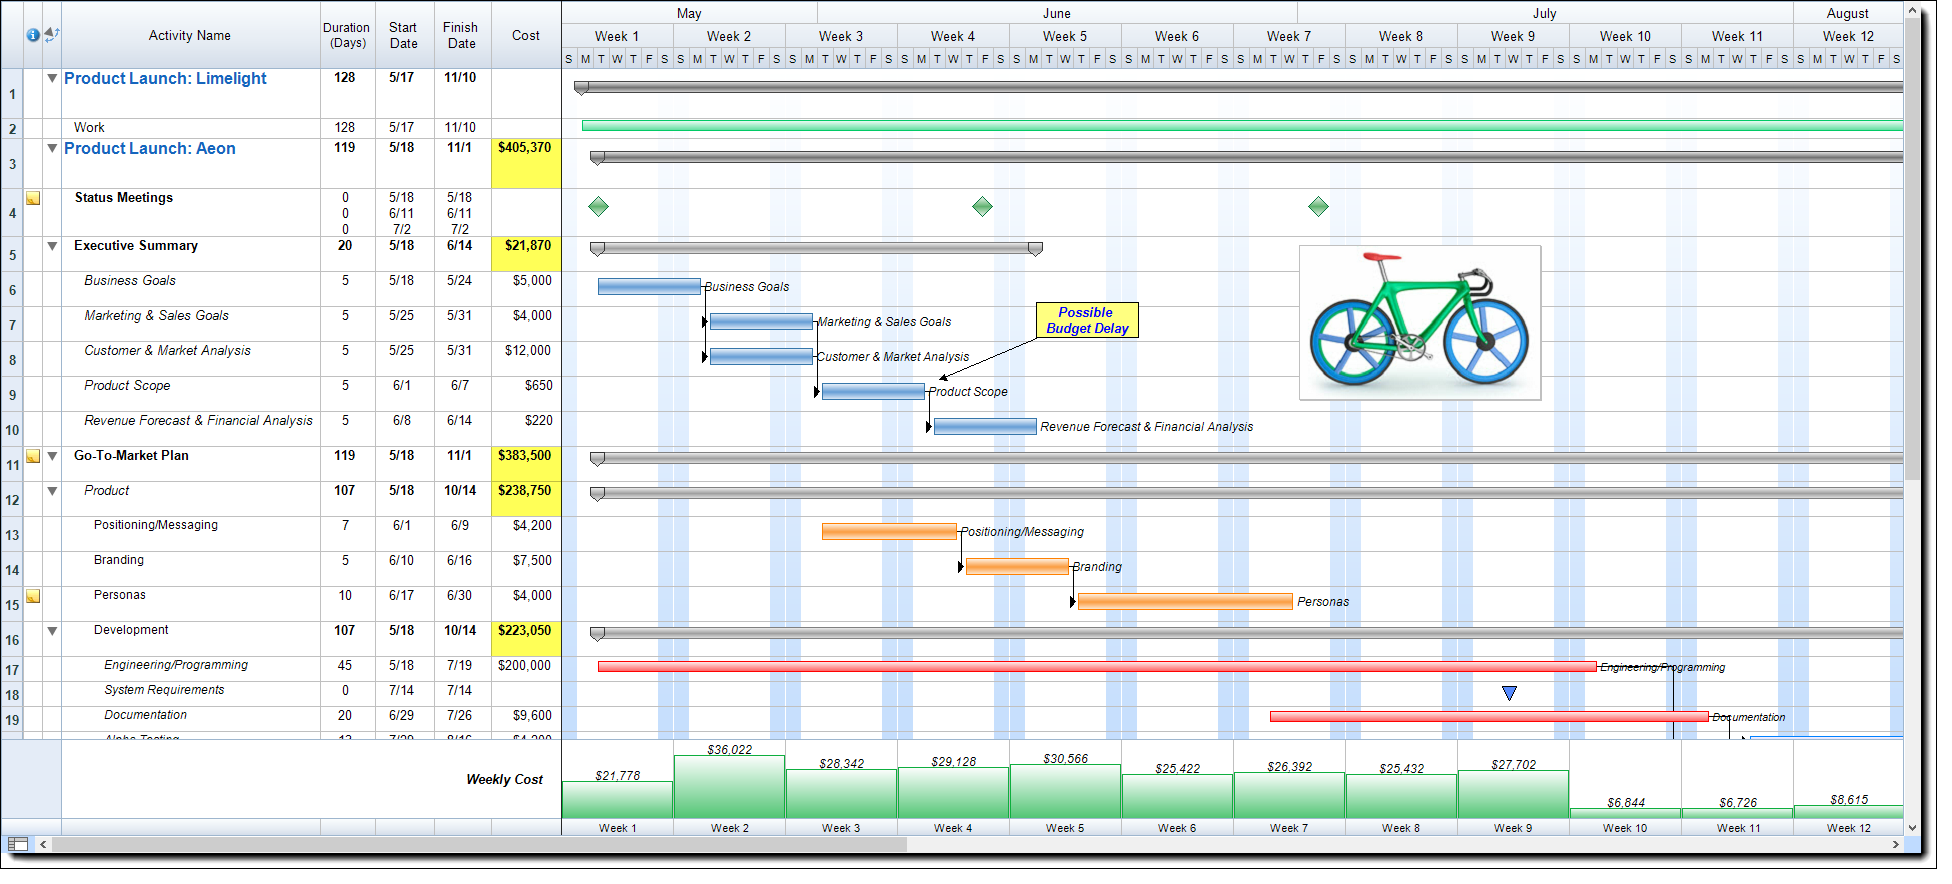
Next select OK to close the Format Column dialogue and display the Summary Row values. We can now see the total Cost values for the high level portions of our project.
FastTrack also offers the ability to display a different type of summary, known as a Column Summary. A Column Summary will appear at the very bottom of the selected column and is fixed in place. This can be very useful because no matter how large your file is or what portion you are currently viewing, the Summary Data will still be visible. By default most pre-defined Cost columns such as Resource Cost or Total Cost already display Column Summaries, however, this summary data can once again be displayed on almost any column in the schedule.
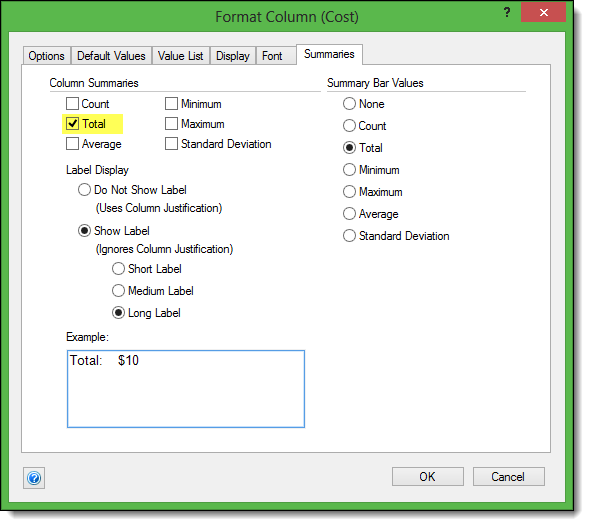
Here we will again enable Column Summaries for our Cost column. To start double-click on the Cost column header and select the Summaries tab. Much like our Summary Bars we have options of Total, Min, Max, Average, etc. Here we will select Total which will display the total combined cost of all tasks in our project. With Column Summaries we can also choose if we wish to have a label displayed and how we want that label to appear.
Once we select OK the Column Summaries will be enabled in our schedule and will appear at the bottom of the selected column.
Using Summary Bars and Column Summaries will give you the power to easily keep an eye on high level data within your project. You can easily use on or the other, or even combine both to always have the information you need at hand. What are some of the different columns that you will utilize Summaries for in order to track project data?