
This Topic was Recently Updated.
When we are building projects, two of the most important types of data that we need to keep track of are budgeted and actual cost values.
- Use the Cost Layout to input a budget and automatically calculate actual costs.
- Create calculations to pinpoint tasks that are over budget within our projects.Identify the amount a task is over budget.
- Make a column automatically display whether a task is over budget.
- Make a label automatically appear on an activity bar to make a over-budget task more noticeable in the Timeline Graph.
Use the Cost Layout to input a budget and automatically calculate actual costs.
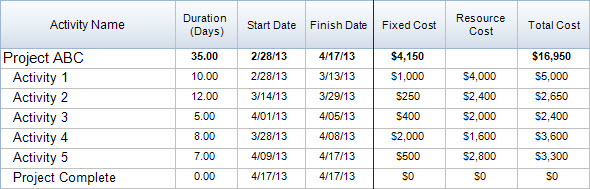
To display a project’s task costs, use the Cost Layout. This will display cost information for Fixed Cost, Resource Cost, and Total Cost.
- Fixed Cost is any cost not directly relating to our resources.
- Resource Cost is calculated based on the resources assigned cost rates and the number of hours they are assigned to tasks.
- Total Cost is the combination of Fixed Cost and Resource Cost.
Notice that in the Cost Layout there is no column for Budget values. We can easily create this on our own.
Create calculations to pinpoint tasks that are over budget within our projects.
First, let’s create a new layout to display our Budget and Total Cost. We will continue to add columns to this layout for items such as the cost variance.
1. Go to Layouts > Define.
2. Select the Main Layout > Duplicate.
3. Input a customized layout name, such as “Variance Layout.”
4. From the Available Columns list, show the columns Cost 1 and Total Cost.
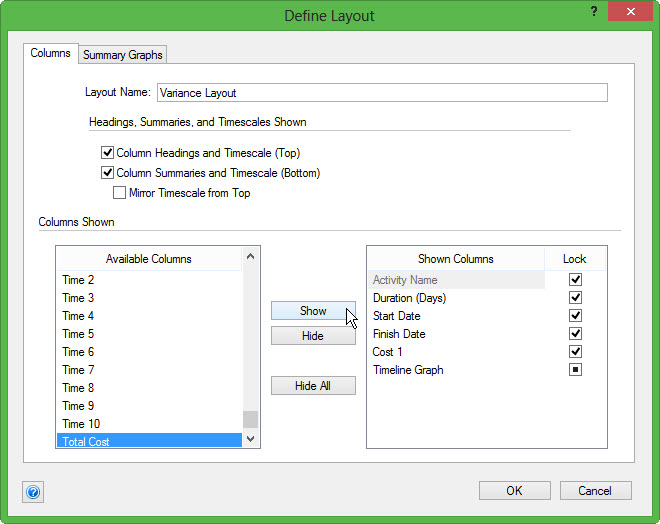
5. Select OK to save the layout.
6. Select OK to close the dialog and open the newly created layout.
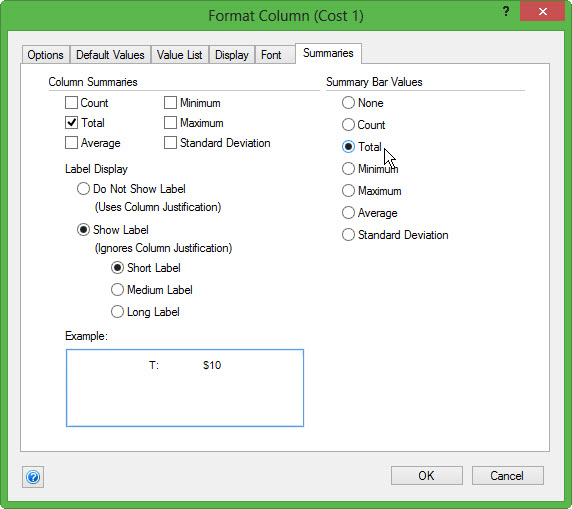
Next, we can customize our Cost 1 column to hold our budget values.
- Double-click on the Cost 1 header.
- Input a column name such as, “Budget.”
- Select the Summaries tab.
- Under Summary Bar Values, choose “Total.”
- Press OK to save and close the dialogue box.
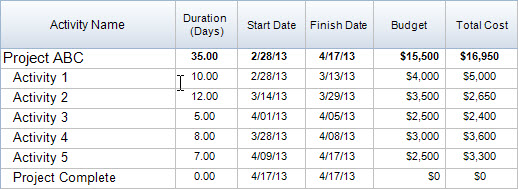
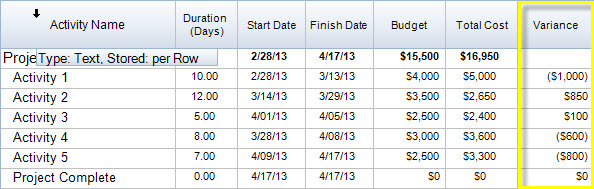
Next, we can input budget values for each task. In our example, we can already see our Total Cost values, however, you typically wouldn’t enter this data until after the budget was created.
Identify the amount a task is over budget.
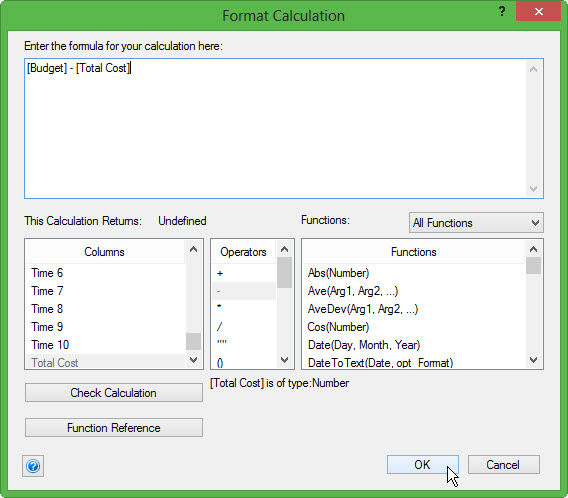
Now that we have values for our Budget and Total Cost columns, we need to build a calculation that can find the Variance (the difference) between those values. This will allow us to pinpoint any activities that are over budget within our project.
- Go to Insert > Column > Calculation 1 to open the Format Calculation dialogue.
- Build your calculation formula by double-clicking:
- In Columns, double-click Budget. This will add it to the formula in the calculation field
- In Operators, double-click on the subtraction sign (-).
- In Columns, double-click Total Cost.
- Our calculation should now read Budget – Total Cost.
- Select OK to save the calculation and close the dialogue box.
Now we will see values automatically populating the column.
To format the column to display the values exactly as we wish to see them.
- Double-click on the Calculation 1 header. A dialogue box will open.
- Input our customized column name, Variance.
- Choose the Display tab and select to show (Negative), $, and zero decimal places.
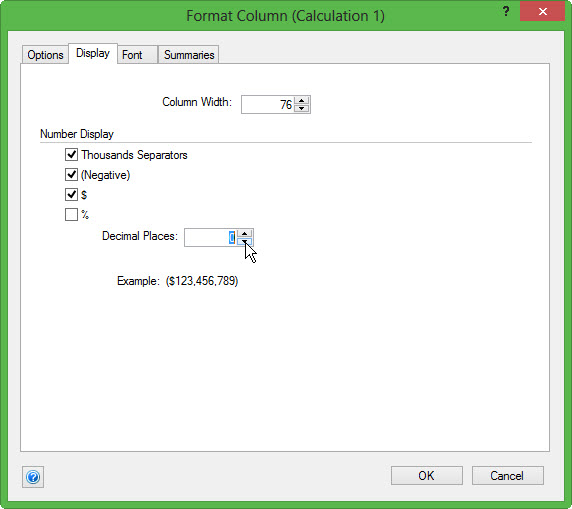
- Choose the Summaries tab, select to show None under the Summary Bar Value. We do this because we want to see individual task variances more so than the entire project variance.
- Press OK to save and close the dialogue box.
Our Variance column is now formated to be more effective with communicating which tasks are over or under budget within our project.
Make a column automatically display whether a task is over budget.
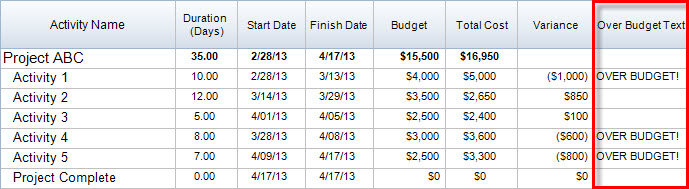
To automatically have a helpful “Over Budget” indicator for over budget tasks within the project, create the following calculation column.
- Go to Insert > Column > Calculation 2.
- From Functions, double-click on If(Cond, Result1, Result2).
NOTE: This is an IF Statement, which conditionally evaluates one or the other result based on the value of the test. - Next, we can enter values into the IF statement. Highlight the COND, then from the columns list double-click on Variance. This will place Variance where COND originally was.
- After Variance, place the operator < for Less than.
- Now we can highlight Result 1 and enter the value we want to appear if Variance < 0 is true.
- Here we will enter a text string “OVER BUDGET!”
- Next we can highlight Result 2 and enter the value we want to appear if Variance < 0 is false.
- Here we will enter a text string for a blank value “” (2 sets of quotation marks).
- When our calculation is built, it should look like:
If([Variance] < 0, “OVER BUDGET!”, “”) - Select OK to save and run your calculation.
In our schedule, this new calculation column will display “OVER BUDGET”
next to all the activities that are over budget within our project.
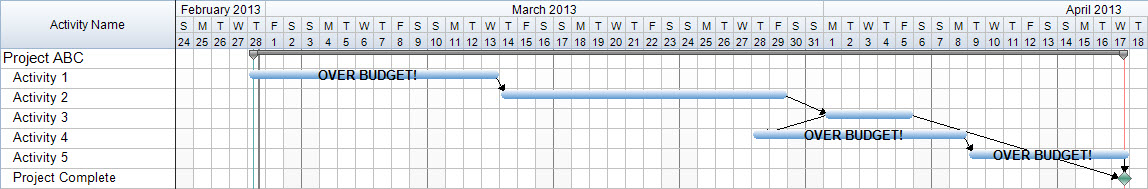
Make a label automatically appear on an activity bar to make an over budget task more noticeable in the Timeline Graph.
To have the OVER BUDGET! text show up on the Timeline Graph as a label on the bars, so no matter what layout we are in, we can always see exactly which tasks are over budget:
- Go to Format > Bar Styles.
- Select the tab labeled Schedule View Labels.
- From available columns, select Over Budget Text then select Show.
This will move the Over Budget Text column to our shown columns as a label on the bar. - Select Apply to add the label to your schedule.
- Select OK to save the label and close the Format Bar Styles dialog.
Now, when we look in our Timeline Graph we can easily see which activities are Over Budget, even if we switch to a layout such as the Basic Layout.
Summary | Call for Input
In FastTrack Schedule 10, there’s an unlimited number and type of calculations that you can build. What are some of the calculations that you’ve experimented with in your projects? Have you found calculations helpful in extracting data you don’t normally see?
