
Resource management can be a major part of any project. It can be key to know when a resource is assigned or when they may be free at any given point as the project progresses. In FastTrack Schedule 10 you can easily view and manage resource workloads and assignments directly within the Resource View. However when you need to assign resources to new tasks it can sometimes be a hassle to switch back and forth between the Resource and Schedule Views. To make this process easy, FastTrack Schedule 10 allows you to pull additional resource utilization information directly into the Schedule View.
While working in the Schedule View, we can pull over both the Percent Work Usage as well as the Hourly Work Usage graphs into a single and simple combined graph. To do this go to View > Percent Work Usage. When you select the Percent Work Usage a blank row will appear at the bottom of your schedule across both the columns and Timeline Graph area.

The Percent Work Usage graph allows for 2 different behaviors. The first, allows you to select a specific task and view the Work Usage graphs for all resources assigned to that task. Here, we select Activity 1 and can see the corresponding graphs for Sue.
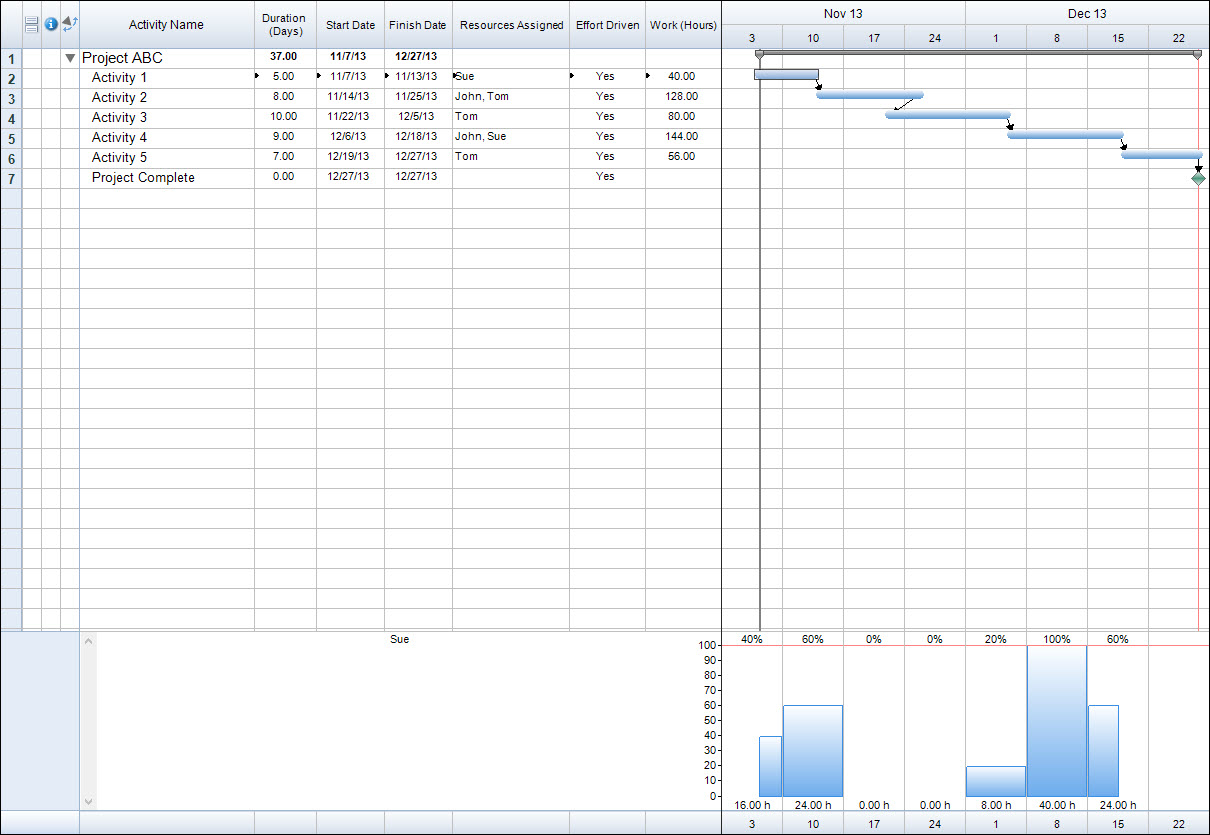
When we use this option we will also see any additional work that the assigned resource or resources are assigned to throughout the rest of the schedule. Here we can see that Sue is also assigned to a task later in the project.
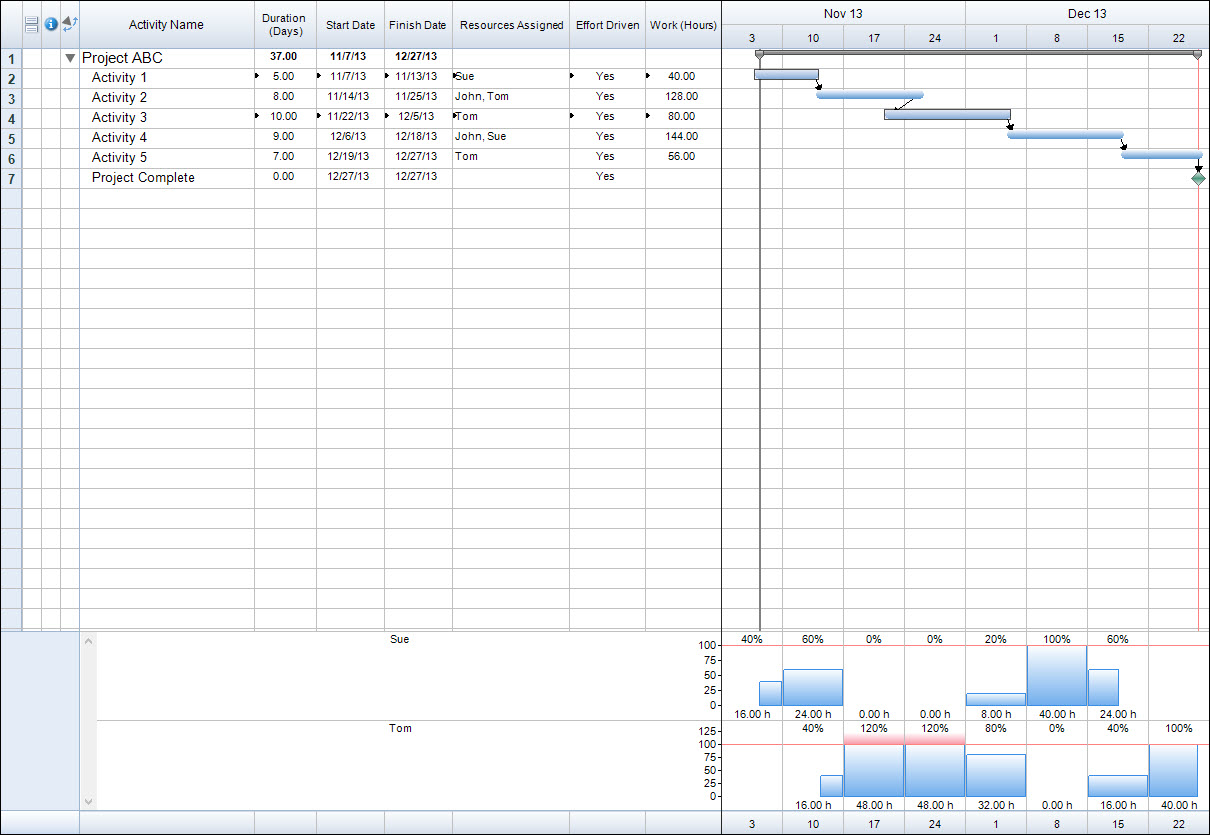
As well as being able to select a single task you can also select multiple tasks. To do this select the activity bar for your first task, then while holding down the shift key select the activity bar for any additional tasks. As soon as you do this the graph will automatically update to reflect this new selection.
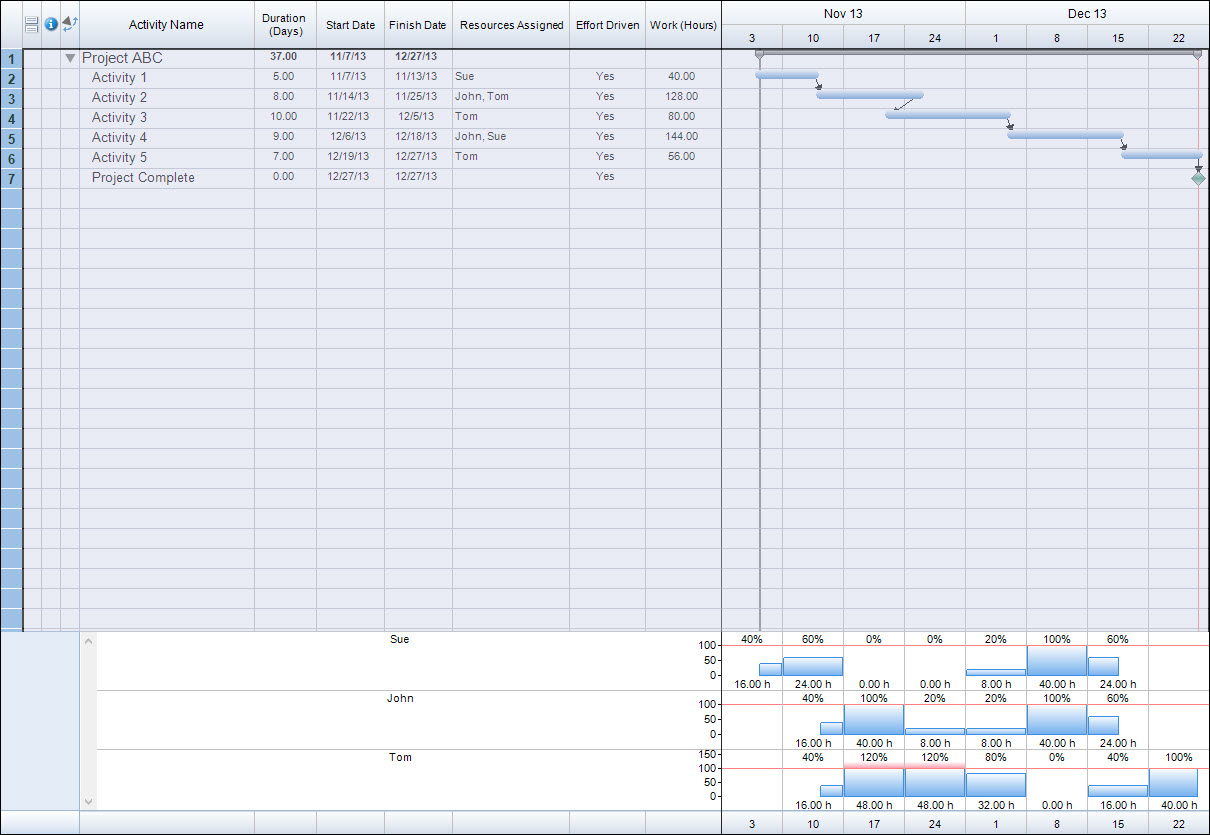
The last option we have is to select all of the tasks within our project, which will allow us to quickly view the work usage graphs for all currently assigned resources within the project. To do this you can use the above method of holding shift when selecting activity bars, or you can select in the box where rows and columns intersect to automatically select all tasks within the project.
In addition to selecting a specific task we can actually change the behavior of the Percent Work Usage graph to allow us to select a specific resource. To do this, Right-Click or Control-Click in the shaded area to the left of the resource names. A context menu will appear where you can de-select the option marked Show Resource By Selection.
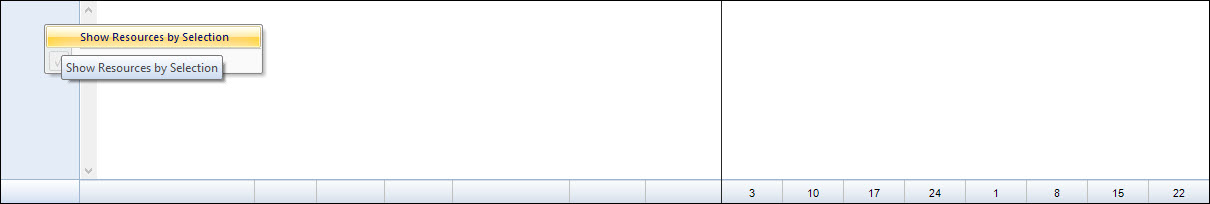
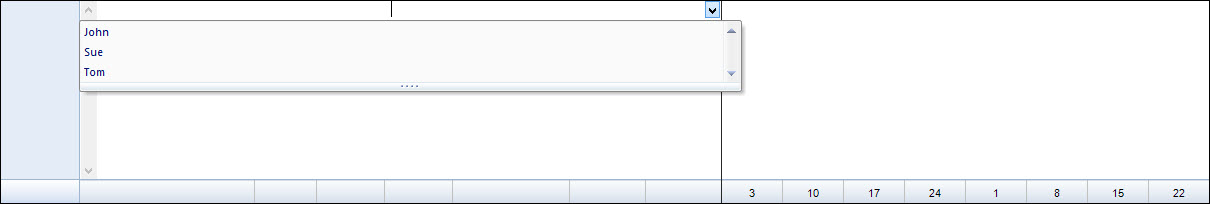
Once you have done this you can then select in the portion of the Percent Work Usage graph which falls below the columns. A drop-down arrow will appear which will allow you to select the exact resource you wish to view.
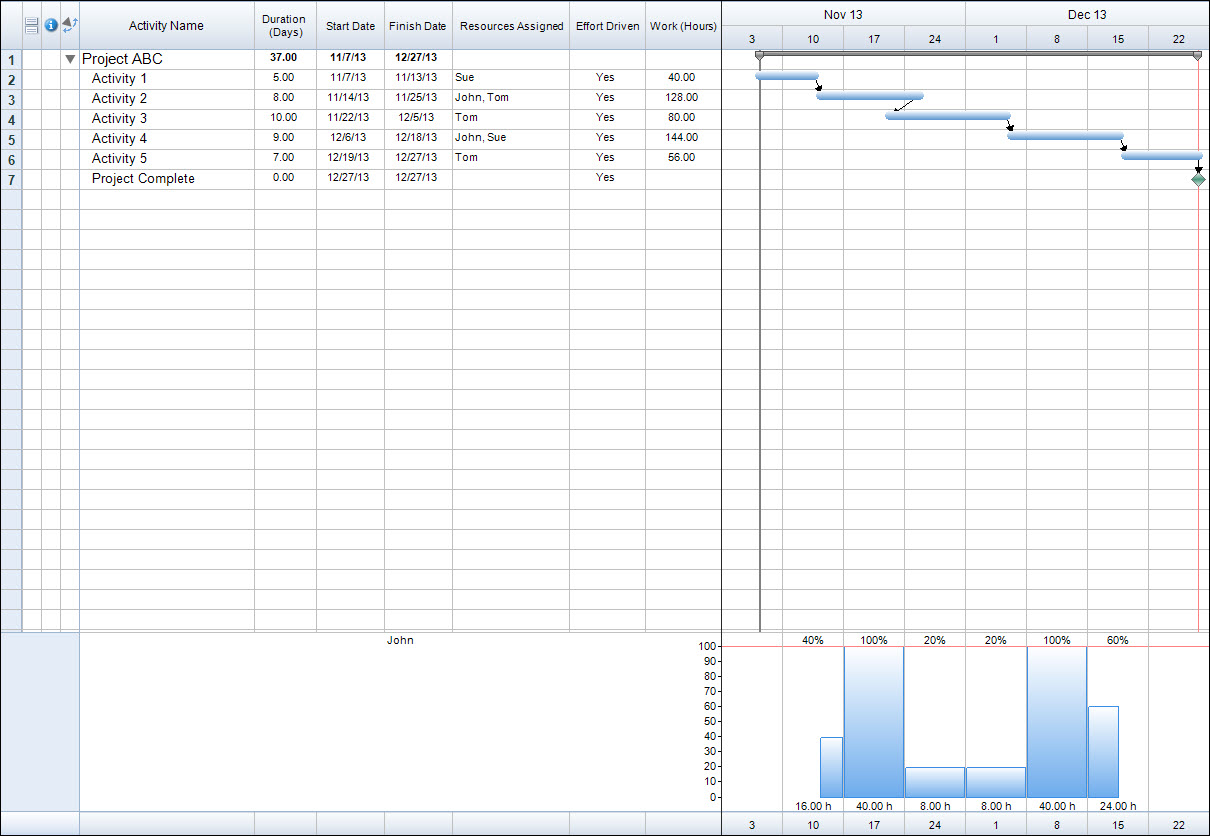
Once we select a specific resource, the Percent Work Usage graph will update to show us the usage of the resource within the project. Here we can easily see when and for how long John will be assigned within our project.
By viewing the Percent Work Usage graph in the Schedule View of our project we can easily track and manage when our resources assigned and how much work they are assigned to do. This can make it much easier to make changes in your project such as shifting tasks or re-assigning resources to reduce over allocations. How can utilization of the Percent Work Usage graphs benefit the way you manage your resource allocations?
