Being able to easily control what data is displayed and how that data is displayed within your projects can be very important, especially when it comes to creating reports or presentations. In FastTrack Schedule 10 users have the ability to utilize various Layouts which control what columns are visible and the order that they are displayed in. We’ve previously taken a look at how to customize our own Layouts within schedules, so today we’ll focus on some of the pre-defined Layout options and how they can be utilized throughout a project.
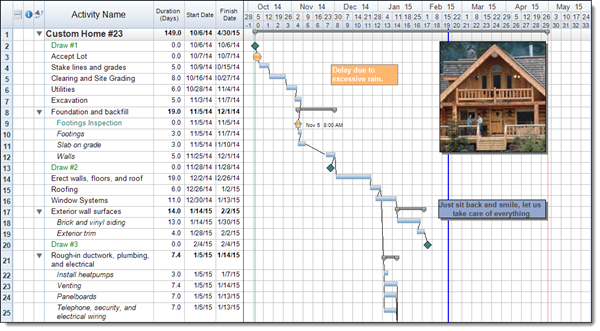
The first Layout that we’ll take a look at is the Main Layout. This is the primary Layout within all schedules, and is the first one that we’ll see when opening up a brand-new, blank file. The main Layout is made up of the Activity Name, Duration, Start Date, and Finish Date columns, as well as the Timeline Graph. The Main Layout is typically the best place to start when planning a schedule as it allows us to enter all of the key data for when everything will occur.
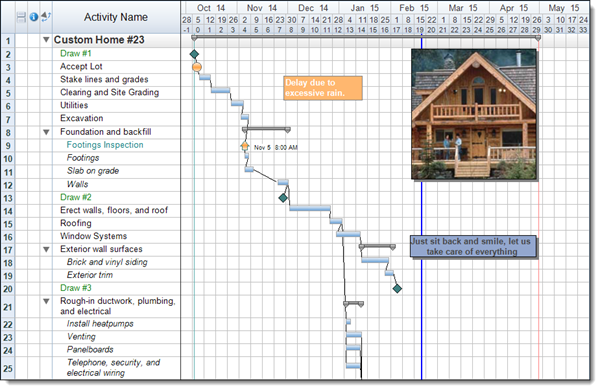
The next Layout that we’ll take a look at is the Basic Layout. The Basic Layout is designed to be very simple and shows only the Activity Name column and Timeline Graph. This is a great Layout to use for more simple presentations, or when a project is planned on a smaller scale. All of the necessary details such as Start and Finish dates can still easily be seen by viewing the Timeline Graph, or by adding supplemental labels to the activity bars.
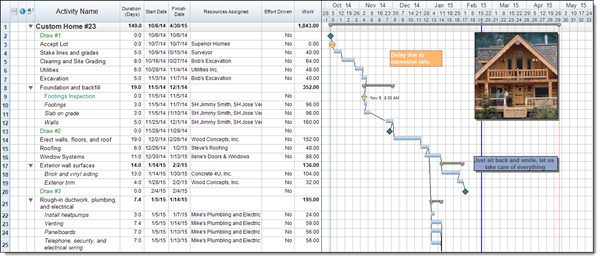
Another commonly used Layout is the Resource Layout. This Layout contains the Activity Name, Duration, Start Date, Finish Date, Resources Assigned, Effort Driven, and Work (Hours) columns, as well as the Timeline Graph. This Layout is designed to allow users to easily assign resources to each of the activities throughout the project. The Effort Driven column indicates the type of scheduling method that is used when resources are assigned to an activity, and the Work (Hours) column calculates the total work hours based on all of the assigned resources in the project.
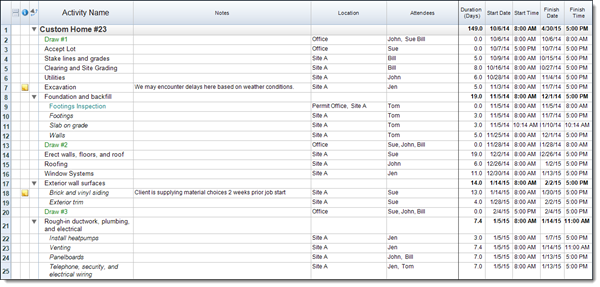
The final Layout that we’ll take a look at today is the iCalendar Layout. This Layout contains only data columns: Activity Name, Notes, Location, Attendees, Duration, Start Date/Time, and Finish Date/Time. The iCalendar Layout is going to be used most frequently to either export or import data to/from various iCalendar applications. For example: FastTrack Schedule 10 can create a .ics file which can be imported into applications such as iCalendar, Outlook, and Google Calendars, along with any other application which works with the .ics file type. This Layout shows the specific information that can be imported or exported to these locations, allowing users to see exactly what data they are able to transfer into their external calendars.
FastTrack Schedule 10 offers an even wider variety of pre-defined Layouts than what we’ve seen today, each of which is designed to allow users to easily control what data is being displayed or help with scheduling certain portions of a project. How can using the pre-defined Layout options help you to increase the functionality of the reports you create?


