
When setting up schedules in FastTrack Schedule, we have the ability to assign unique bar styles to any of the activities that we create. Typically bar styles are assigned with some sort of specific meaning in mind. For example, they may be used to represent the resources assigned, the phase of the project that task occurs in, or even the type of task that it is. When we assign these styles it may be easy for us to recall what each style represents, but when we share schedules with others they may have no clue what each style indicates.
To make it easier for users to understand the bar styles and their meanings we can easily add in a Legend in any location within our schedule. There are two ways a Legend can be added:
- Schedule View. A Legend added directly to the Schedule View, can be helpful when exporting the schedule as an image. -OR-
- Print Preview. A Legend created in Print Preview will only show up when we print or create a PDF of the schedule.
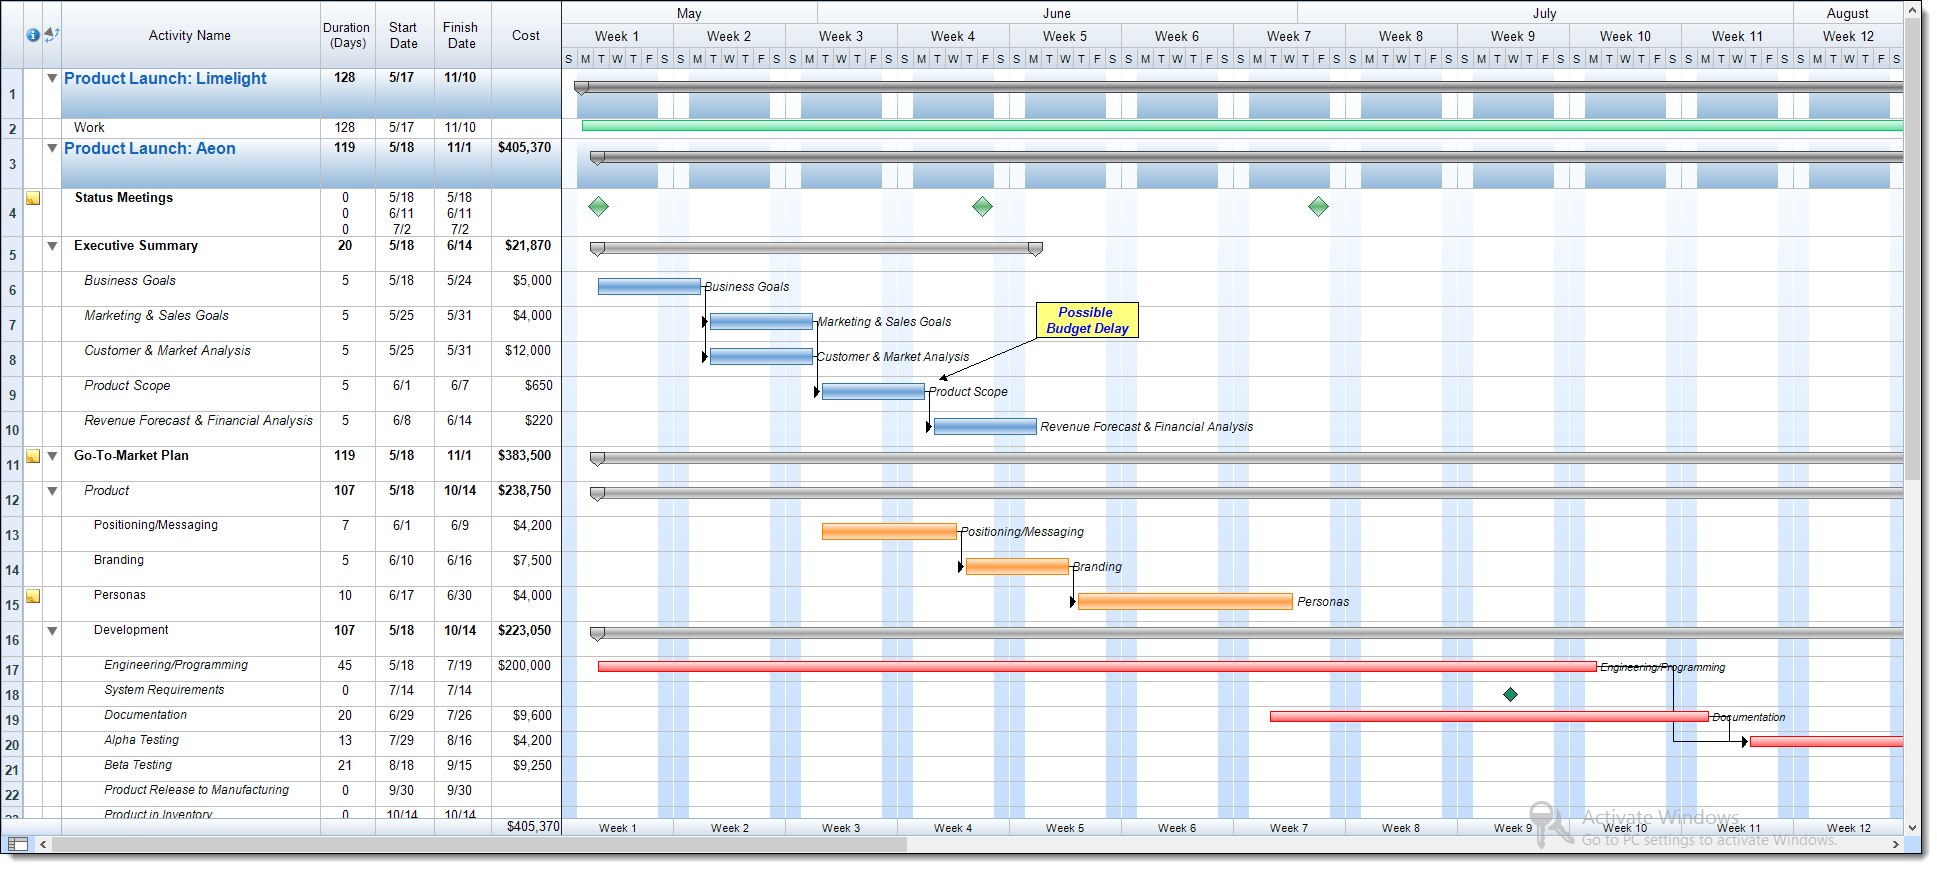
As we can see in the schedule below, bar styles have been assigned to the specific phases of the project.
Create Legend in Schedule View
The first option that we have for legends is to insert one directly within the Schedule View. These types of Legends will appear in only that location. For example, when we print the schedule the legend will only appear in the portion of the Timeline Graph where it has been inserted. To add the legend go to Insert > Legend. This will open the Format Legend dialogue.
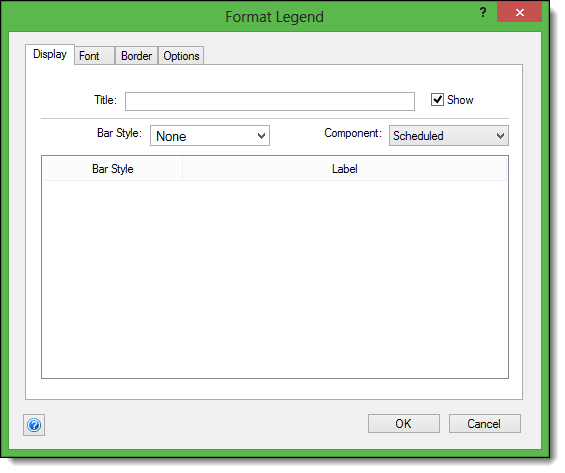
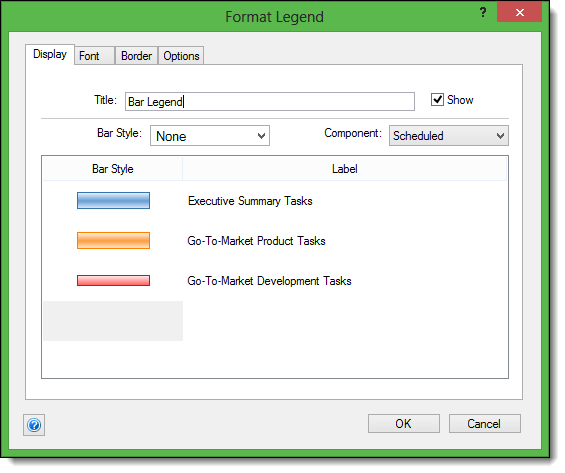
The first option that we have is to set the title for the legend. Here we can put any text we want, or we can even leave it blank if we do not want a title to appear. Next, we can pick which bars we wish to add to the legend and what label we want displayed. To add a bar to the legend, select under the Bar Style header.
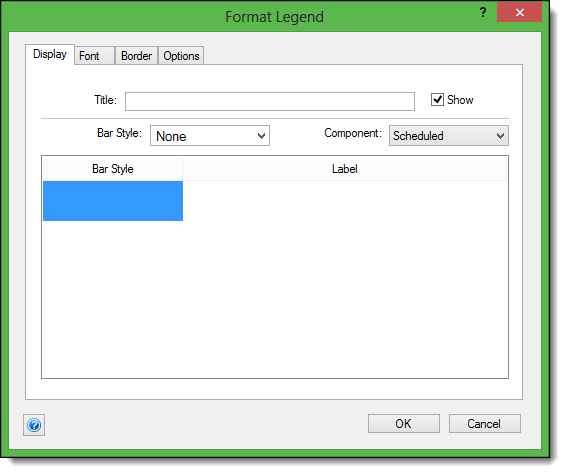
Select the bar you wish to add from the Bar Style drop-down and then select in the Label header beside the bar. For our bars I’ll enter the name of the phase they represent, in other cases we could enter values such as the resource name, type of task, etc. Once we’ve added one bar click in the area below that bar to add a second, and repeat as necessary for all other bars you wish to display in the legend.
Once the legend is finalized select OK to close the dialogue and place the legend into the Timeline Graph. When inserted the Legend will appear in the center of the Timeline, but can be moved or re-sized by clicking and dragging to any location in the graph. Now anytime we print or export as an image the legend will always appear fixed within that portion of the Timeline Graph.

The second option we have for our Legend is to insert it into Print Preview. First go to Print Preview, then Insert > Legend. We can once again set the legend up just as we did within the schedule view. However, before selecting OK switch to the Options tab. Within Options we can set exactly what pages the legend will appear on. We have the options of showing it on All Pages, This Page (which places it on the currently viewed page in Print Preview), or a Page Range. With these options we could potentially create several legends that display only the bars shown from one page to the next. Once again select OK to close the dialogue and insert the legend.

By using either of these legend options we can easily assign different meanings to each of the activity bars we have used. In turn this makes the schedules more presentable and easily understood when we share them with clients or stake holders. How can inserting a legend in your schedule help to add to the overall presentation value?
