Cost control is necessary in every project phase to keep your project on budget. FastTrack Schedule’s Summary Graphs track and display project costs in colorful time-based graphs that make it easy to identify cost trends, pinpoint cost overruns, and anticipate costs of work that remains. Visualizing costs in time-based segments (weeks, months, quarters, et al.) helps you keep a watchful eye on overall project health and provides essential cost reports without the need for Excel.
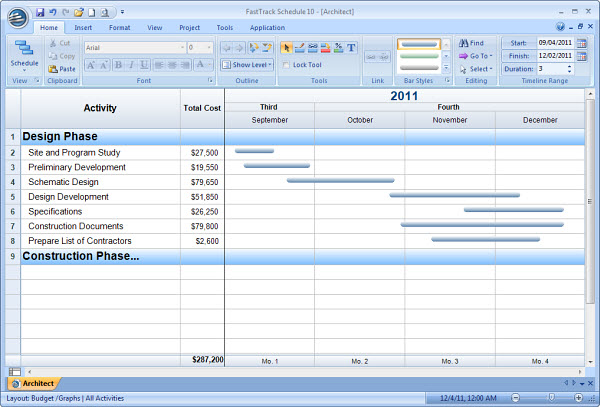
In the schedule below, you’ll find a cost per activity breakdown. What about seeing costs over time?
Summary Graphs can be used to easily display these costs across periods of time. Data used to create Summary Graphs are always taken from column data and is distributed across the duration of the activity. Once a summary unit and operation are defined, the graph is generated.
1. To Insert a Summary Graph:
a. Go to the Insert menu, select Summary Graphs
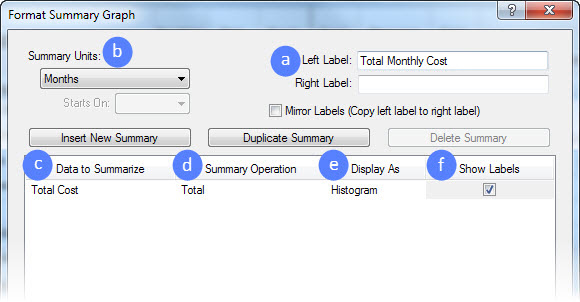
2. Format Summary Graph dialog appears:

Define the following options:
a. Left Label – Describe the data being displayed
b. Summary Units – Units the data is summarized as (Hours, Days, Weeks, Months, etc.)
c. Data to Summarize – Select which column’s data you are summarizing
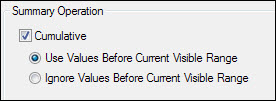
d. Summary Operation – How you want the data summarized (Count, Total, Average, etc.). When selecting the Summary Operation, there is an additional option found within the dialog for a Cumulative Summary:

e. Display As – The style of your graph (Text, Line, Histogram)
f. Show Labels – Display values within graph
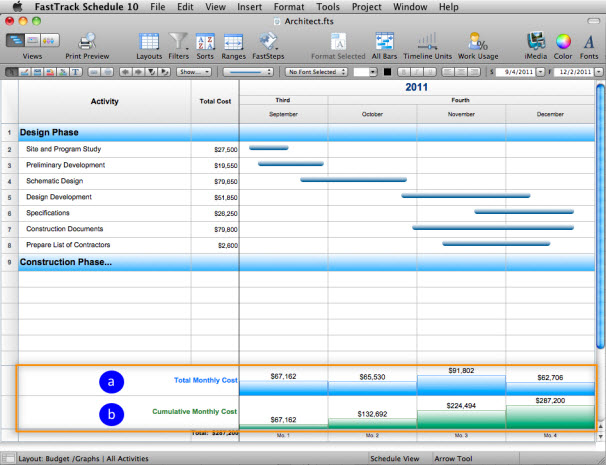
3. Select OK and you will see the summary graph along the timeline graph:
a. Total Monthly Cost – Summary Operation was defined as Total
b. Cumulative Monthly Cost – Summary Operation was defined as Total and the optional Cumulative Summary was selected
4. Format an existing summary graph by double-clicking on the summary graph in the timeline graph area or by going to the Format menu, select Summary Graph or Format Selected (on Windows Ribbon Bar).
5. Insert an existing summary graph into another Layout by editing the desired Layout. To edit a Layout:
a. Go to the Project menu, select Layouts then Define
b. Select the desired Layout, select Edit
c. Switch to the Summary Graphs tab
d. Select the desired Summary Graph and click Show
e. Select OK
To learn more about adding Summary Graphs to Layouts, watch our FastTrack Schedule Quick Tip video “Reporting project details with layouts”– Mac Version | Windows version.


