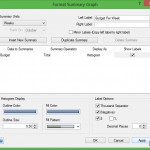
08/06/2015 by Jackie Dembinsky Tags: Cash Flow, FastTrack Schedule 10, Reporting, Summary Graphs, Tips and Tricks
In our projects there can be a wide variety of data that we need to keep track of such as dates, durations, resources assigned, costs, and other data. However we may not always be able to display the data we wish to track directly within a column. In some cases we may want to easily […]
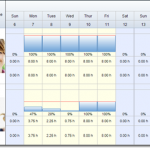
09/04/2014 by Jackie Dembinsky Tags: FastTrack Schedule 10, Resource Management, Resource View, Resource View Summary Graphs, Summary Graphs, Tips and Tricks
Resource management is often one of the most integral aspects of planning and tracking projects. An efficient project manager needs to be able to easily identify when resources are assigned, when they are free, and if there are any “trouble” areas, such as over-allocations, throughout the project. In FastTrack Schedule 10 we can easily identify […]
03/28/2013 by Jackie Dembinsky Tags: Cost Tracking, FastTrack Schedule 10, Project Cash Flow, Summary Graphs, Tips and Tricks
We’ve learned in previous blog posts how to easily format customized columns and calculations to track costs throughout our projects. When we’ve done this in the past, we’ve viewed the data per task but not as a distribution through the time of the project. FastTrack Schedule 10 gives us additional tools, which will allow us to display data, such […]
![Displaying Project Costs Over Time With Summary Graphs [HOW-TO]](https://blog.aecsoftware.com/wp-content/uploads/2012/01/FTS_HowTo_SumGraph1.jpg)
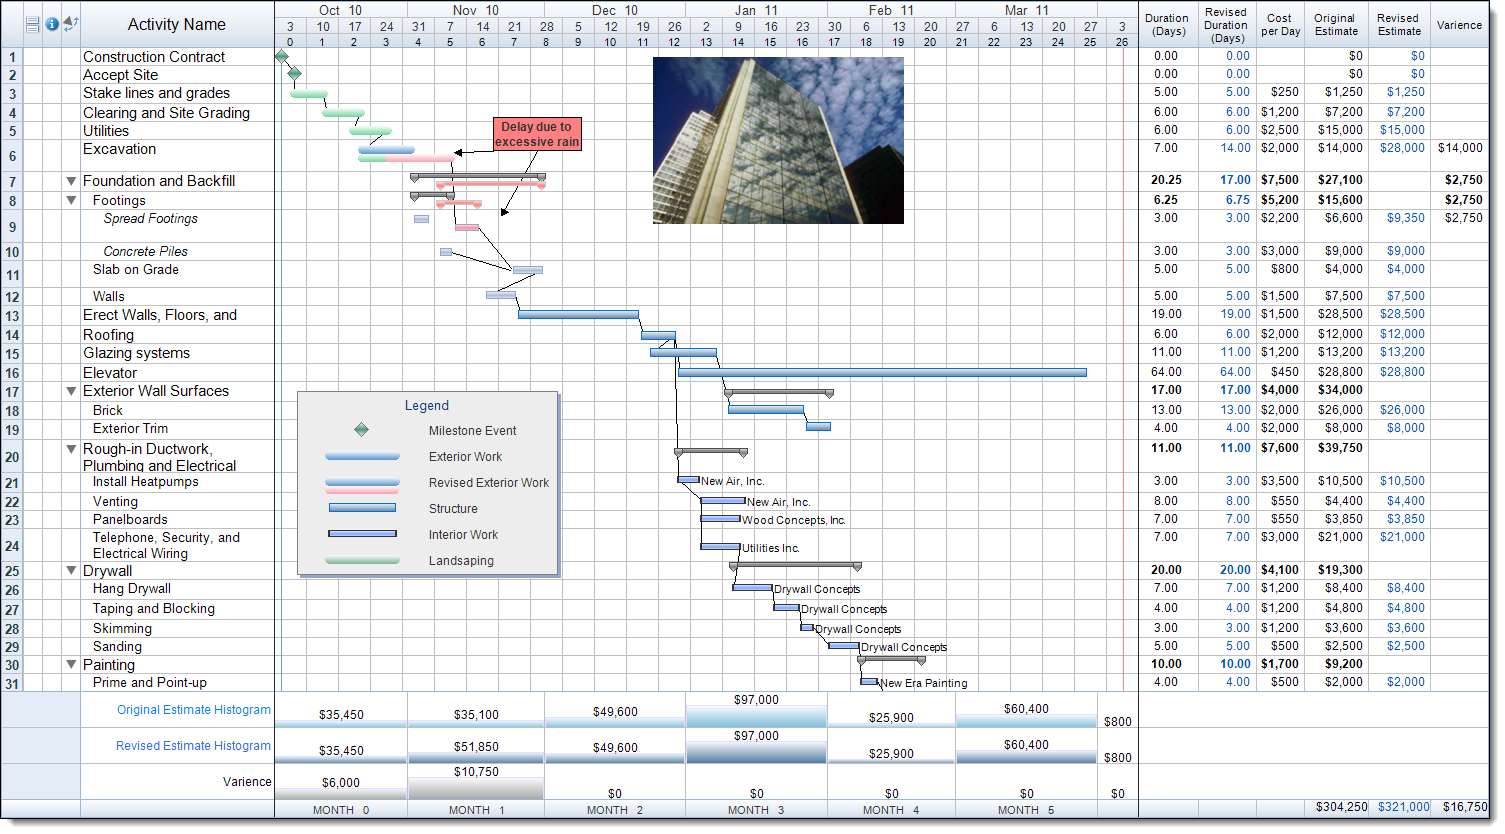
01/18/2012 by Jackie Dembinsky Tags: FastTrack Schedule, Project Cost Control, Summary Graphs, Tips and Tricks
Cost control is necessary in every project phase to keep your project on budget. FastTrack Schedule’s Summary Graphs track and display project costs in colorful time-based graphs that make it easy to identify cost trends, pinpoint cost overruns, and anticipate costs of work that remains. Visualizing costs in time-based segments (weeks, months, quarters, et al.) […]
